Running and Understanding Attendance Reports
4 min read
Running Reports Guide

Introduction
Welcome to the Allday Time Systems Running Reports Guide.
This document will cover:
‘My Shift’ system:
- How to use dynamic data grid
- How to view and export the Clock Card Report
‘Advanced Shift’ system:
- How to run the Full Period Details report and export to PDF
- How to run the Weekly Payroll report and export to Excel
Running Reports: My Shift Users #
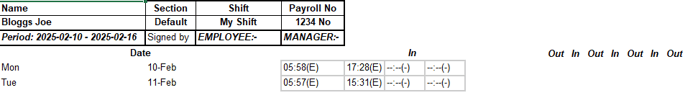
Clock card report
The clock card report is a PDF report that allows you to view employee data across a period. The report is used to view employees’ clock-ins and clock-outs.
How to use the Clock Card report
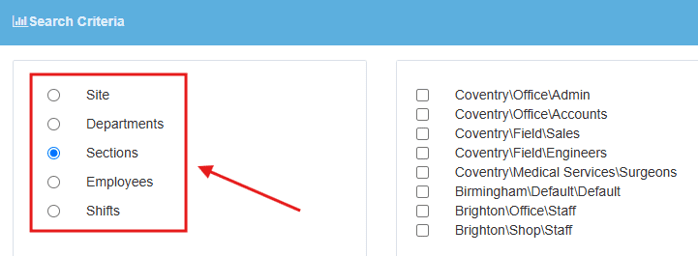
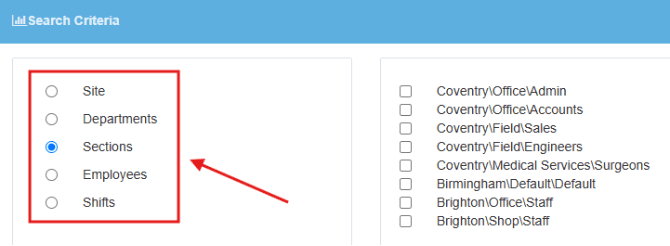
A clock card report is a PDF report that allows you to check clocking information for the following:
- Site
- Department
- Section
- Individual employees
You can filter these reports as listed below.

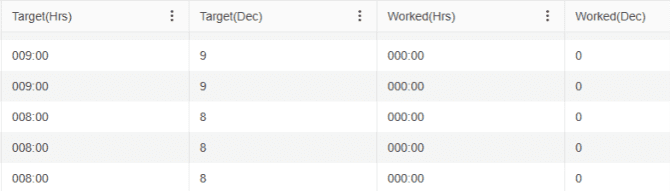
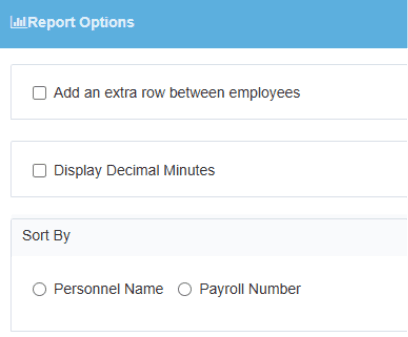
Within the ‘Report Options,’ there is an option to have minutes on the report displayed as decimal numbers. You can additionally sort and organize the clock card report by personnel name and payroll number.
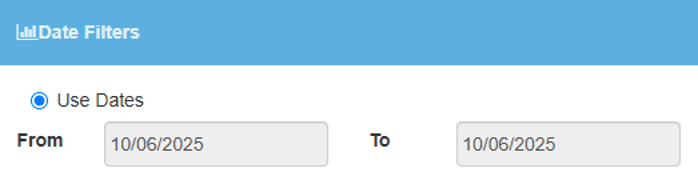
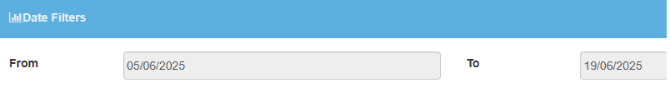
Within the ‘Date Filters Tab,’ you can filter the report using dates.

From the ‘Other Options’ section, you can change the report orientation between Portrait and Landscape.
There are also options to filter the report through absence categories and exceptions.
Once completed, you can select from the report export types, PDF or Excel, under the ‘Report Type’ dropdown.
Once finished with the options, click ‘Generate Report.’
PDF & Excel Report
The PDF and Excel report generated will display the employees:
- Clock-ins and clock-outs
- Period (date range)
- Shift type
- Payroll Number
- Target hours
- Actual hours
- Absence (if any)
PDF Report
Excel Report
Dynamic Data Grid Report
The Dynamic Data Grid is a customizable Excel report that provides employers with detailed time and attendance data for employees.
How to use the Dynamic Data Grid report
You can use this report to run the ‘Full Period Details’ and filter it with the following options shown below.
Under the ‘Report Options,’ you can choose whether you want the report to be Period Attendance Cost or a Daily Attendance Cost.
Next, within the ‘Date Filters Tab,’ you can filter the report using dates.
From the ‘Other Options’ section, you can change the report orientation between Portrait and Landscape.
There are also options to filter the report using absence categories and exception filtering.
Once completed, click on ‘Load Data’ to export all employee data, pulled and filtered, into an Excel file. This Excel will be the Full Period Details report.
The full attendance report is a fully customizable report that displays employee
- Attendance
- Overtime
- Worked
- Absence
The top row of the Excel export table, ‘Full Period Details,’ contains all the remaining categories.
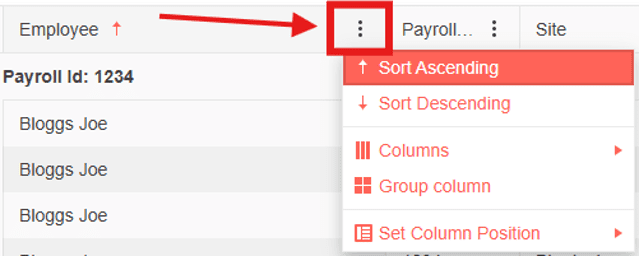
You can edit each category by selecting the ellipsis menu.
The editing options are listed below.
You can also move categories around by selecting and holding the category title.
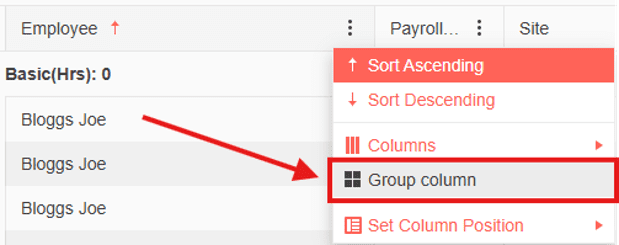
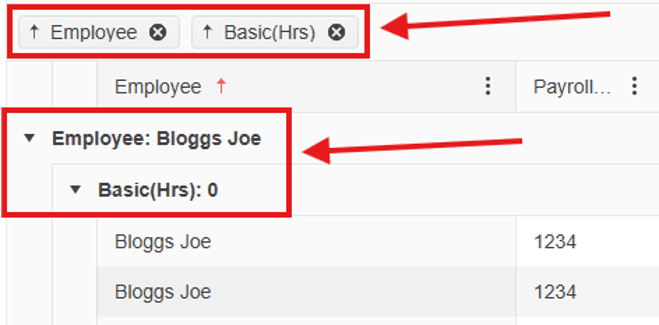
Additionally, you can group columns by clicking on the ellipsis menu and selecting ‘group column.’
When you group columns, all the columns that have been grouped will appear at the top of the Excel export, underneath column titles.
Running Reports: Advanced Shift Users
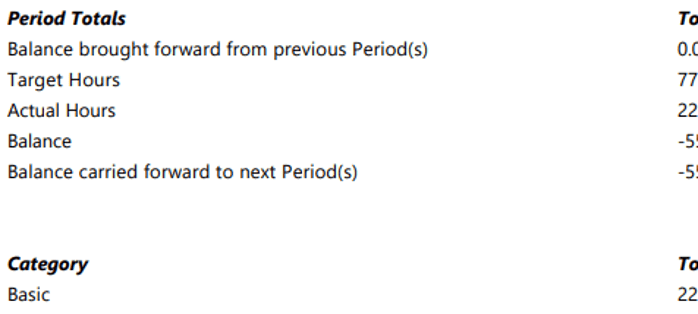
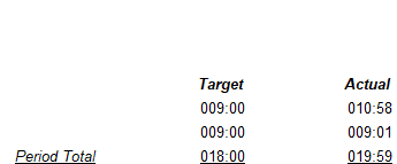
Full period details can be generated in PDF and Excel reports. This report enables an employer to view all employees’ time and attendance data and provides full information about employees’ period clockings.
Note*: By default, a period refers to an entire week.
The export additionally displays
- Target hours
- Actual hours
- Balance
- Absences (if any)
How to use Full Period Details Report
In the Full Period Details Report you can choose where you want the data to be collected from through filtering by the options shown below.

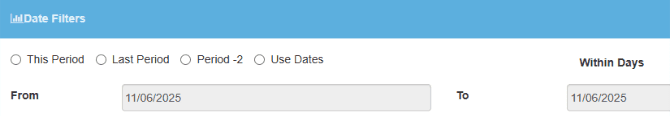
Under the ‘Date Filters’ section you can filter the dates the report should generate from, as shown below. If you want to use specific dates to filter the report, ensure that the dates cover your employees’ full period range.
Note*: By default, a period is equivalent to one week unless edited.
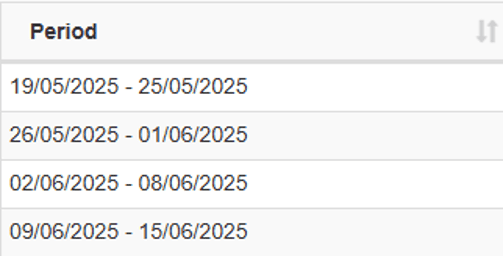
Note* 2: To check an employee’s period, navigate to their profile, select the ‘Totals’ tab, and select the ‘Totals Data’ dropdown.
The example below shows that the employee is on a Monday to Sunday period.
If still unsure, contact the support team at support@alldaytime.co.uk.
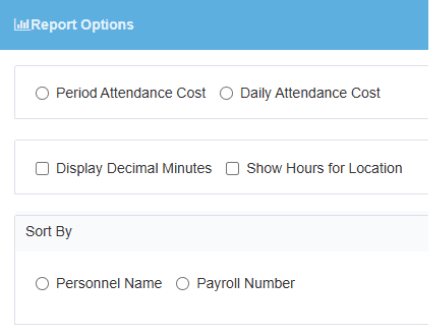
From the ‘Report Options’ section, you have the option to display minutes on a report through decimal minutes or hours for location. You can additionally filter the report by:
- Sort By Personnel Name or Payroll Number
- Report Orientation: Portrait or Landscape
- Exceptions
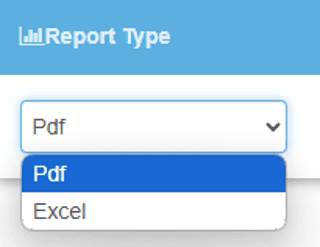
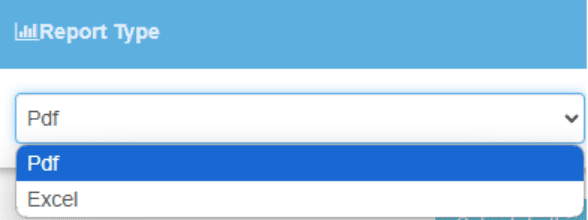
Once completed, select an export choice from PDF or Excel.
Then click ‘Generate Report.’
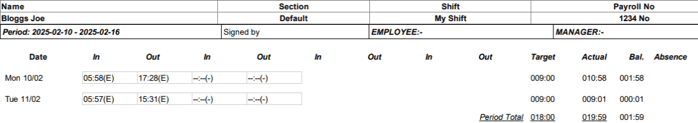
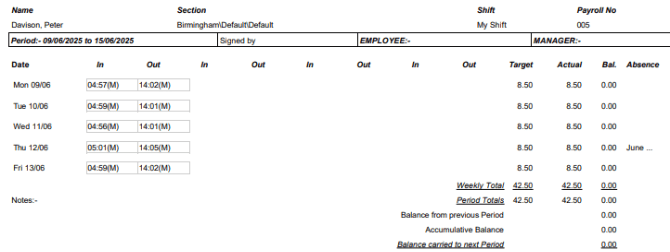
The Full Period Details Reports display all ‘time attendance’ data of an employee. The format for the report goes as one employee per page.
How to use Weekly Payroll Report
The weekly payroll report is a PDF report that generates an employee’s worked hours. The report allows an employer to view an employee’s:
- Target hours
- Weekly total
- Day total
- Basic & Overtime Totals
- Absence booked & hours
In the Weekly Payroll Report, you can choose where you want employees’ data to be collected from through filtering by the options shown below.
From the ‘Date Filters’ section, you can filter the report through dates.
Note*: Ensure the date range matches the employee’s period.
From the ‘Report Options’ section, you have the option to display minutes on a report through decimal minutes or hours for location. You can additionally filter the report by:
- Sort By Personnel Name or Payroll Number
- Add an extra row between employees
Once completed, choose an export option: PDF or Excel.

Then click ‘Generate Report.’
The generated Weekly Payroll Report formats employees, one per row on the export table by default, as shown below.
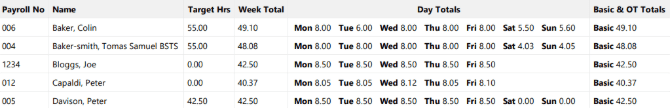
The report additionally displays all the employees’ totals at the bottom of the report.