
Attendance reports for Myshift employees
7 min read
What reports can I use?
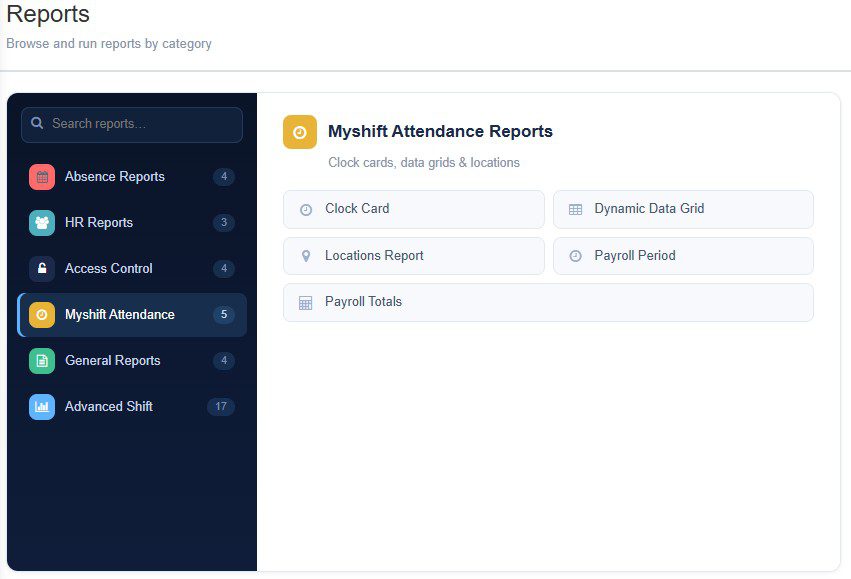
MyShift has several powerful specific reports available,
Clock Card
report for a straight view of the weeks clocking times and booked absences with calculation of hours.
Dynamic Data Grid.
A powerful customizable Excel report that provides employers with detailed time and attendance data for employees
Payroll Period Report
A powerful customisable Excel report giving in depth details of the Hours and absences for the specific payrol group and payroll you are about to run
Payroll totals
An Excel report showing a breakdown of the hours you would be sending to integrated Freetime Payroll if you are using that feature.
Clock card report #
The Clock Card Report is a PDF report designed to allow you to quickly check the clocking information for a site, department, section, or selection of individual employees.
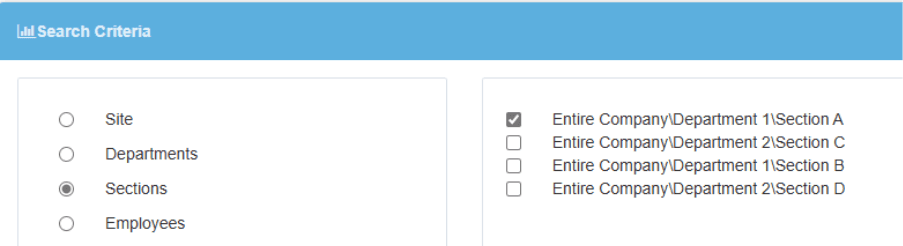
We must first choose which of these we would like to create a report for. In the example below, we have chosen to select by section and chosen Section A of Department 1.
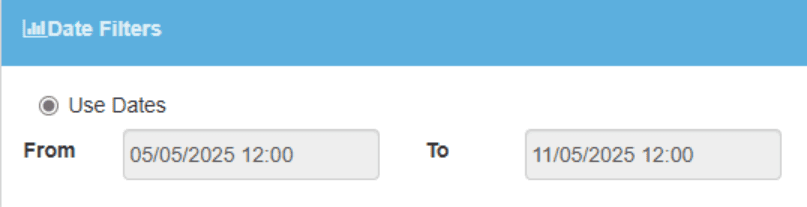
We then choose the date range—in this example, we are choosing to look at a whole week from Mon-Sun, 5/5/25–11/5/25. However, you can choose any date range you like, from a single day to multiple months.
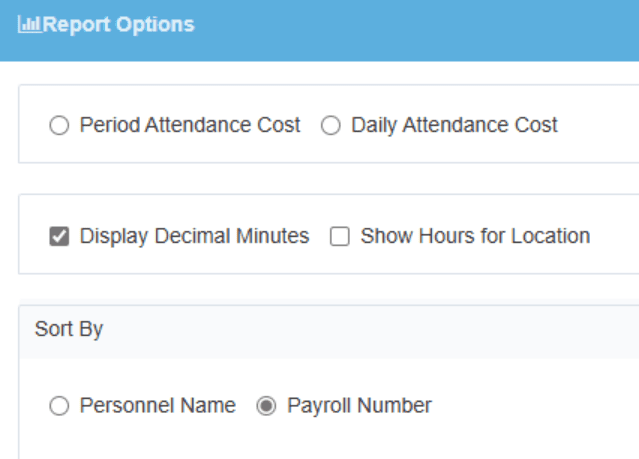
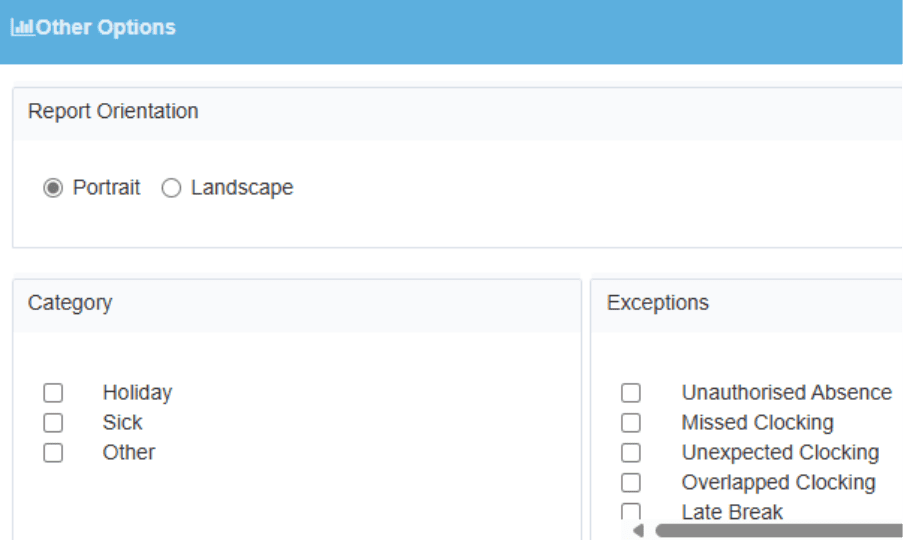
Before we generate the report, we have some other options we can choose from, such as whether we want to display decimal minutes and if we want to sort by personnel name or payroll number.
There are also options such as choosing what exceptions we want the report to show.
When you’re happy with the options you’ve selected, click Generate Report.
Depending on the number of employees and the date range you’ve selected, it may take a few minutes to generate.
Dynamic Data Grid #
MyShift allows you to set up your own custom Excel exports using the Dynamic Data Grid.
You can even save each customisation as a filter so you do not need to make each set of changes next time just select the filter.
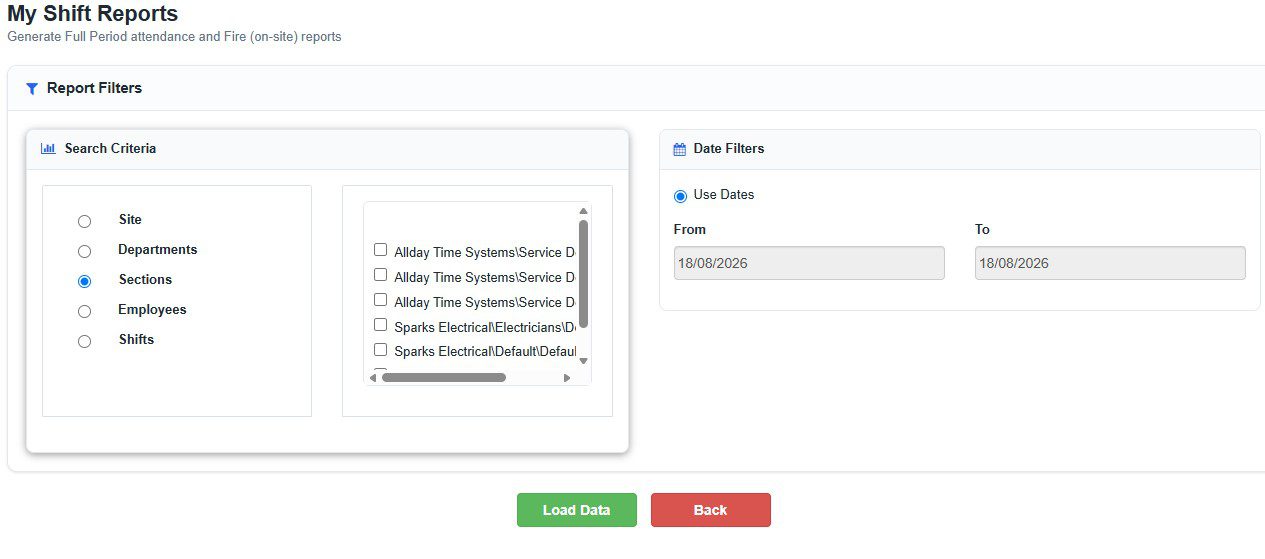
To use the grid, you must first filter the data you want to see the same way you selected in the clock card report.
Select your primary and secondery search filters from the list available Site/Departments/Sections/Employees/Shifts,
Select your date range
Click on Load Data button
after a short time the lower part of the screen will populate with the requested data.
This data can be filtered regrouped or rearranged as needed ready for export to excel. Simply click on the column headers to access the rearrangement or filter options . or click and drag on column headers to move.
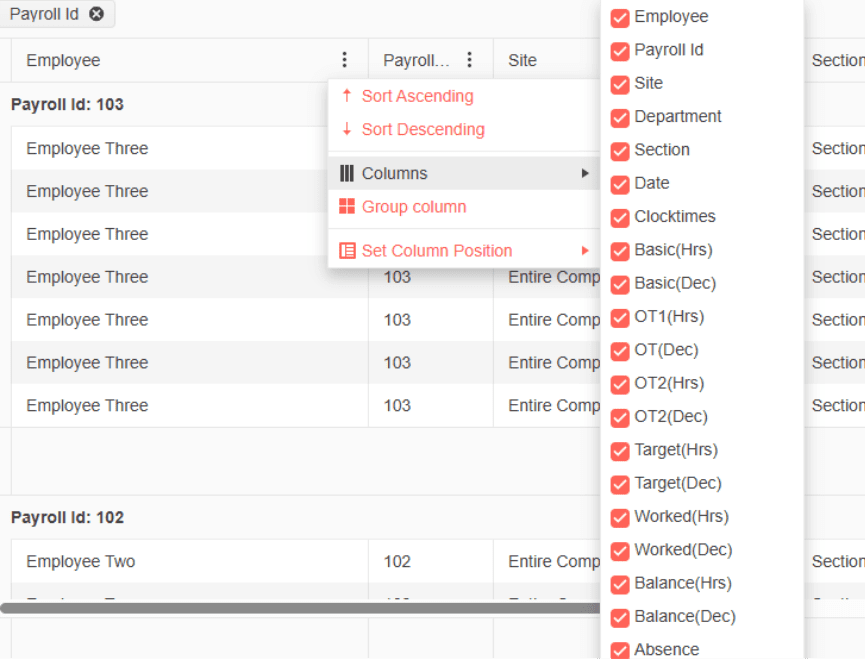
By default, the grid will arrange the data by employee payroll number. However, you can click the three dots on any column header to group the data by that column and use the “columns” tick boxes to decide what you want it to export.
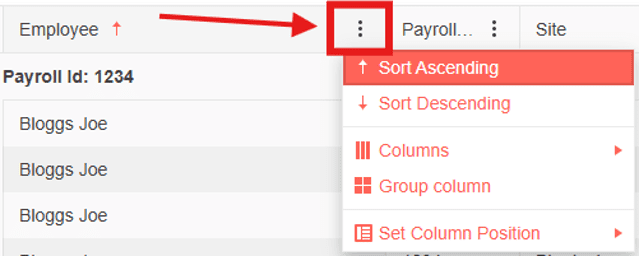
You can even arrange the columns yourself by clicking and dragging them or using the “Set Column Position” option.
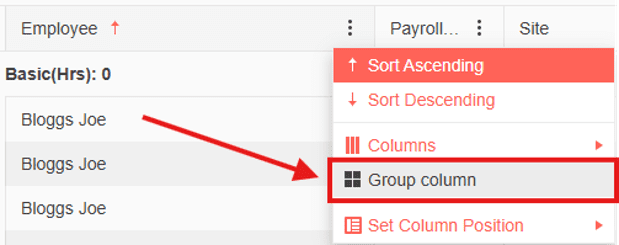
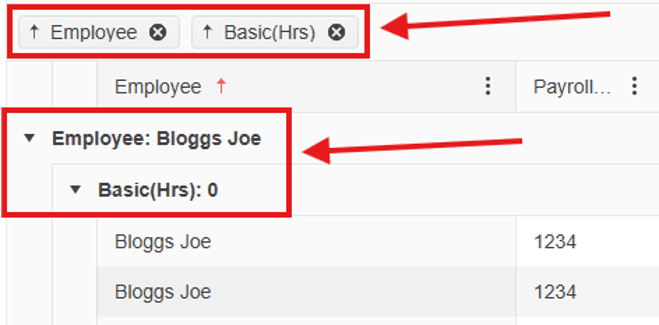
When you group columns, all the columns that have been grouped will appear at the top of the Excel export, underneath column titles.
Before you export, there’s also the option to save the export you’re creating for later use at the top:

Creating templates allows you to quickly load the export options you prefer or use regularly. When you’re done, simply click ‘Export to Excel’ for Freetime to convert your selections to an Excel document, which will auto-download to your downloads folder.
For further help and assistance, please contact the Allday Time support team via live chat for an instant response on the system or email support@alldaytime.co.uk or call 01252 544457.
Locations Report #
Locations can be defined as a specific attendance terminal or a geo fence location using mobile app for attendance. Or a site or location can be created and managed in the system dictionary and attendance terminals or geo fence locations can be assigned to this.
Locations can be viewed and monitored int Site / Projects dashboard giving more in depth detail about the activity at that site or project
To use the grid, you must first filter the data you want to see the same way you selected in the clock card report. In the example below, we have once again selected Section A of Department 1. This time we’re filtering for Monday 26 May to Friday 30 May.
It’s also important you choose the type of report from the drop-down, as this will further filter the data to the format you want from the system. In this case we’re choosing the Full Period Details report to get all the information the system has.
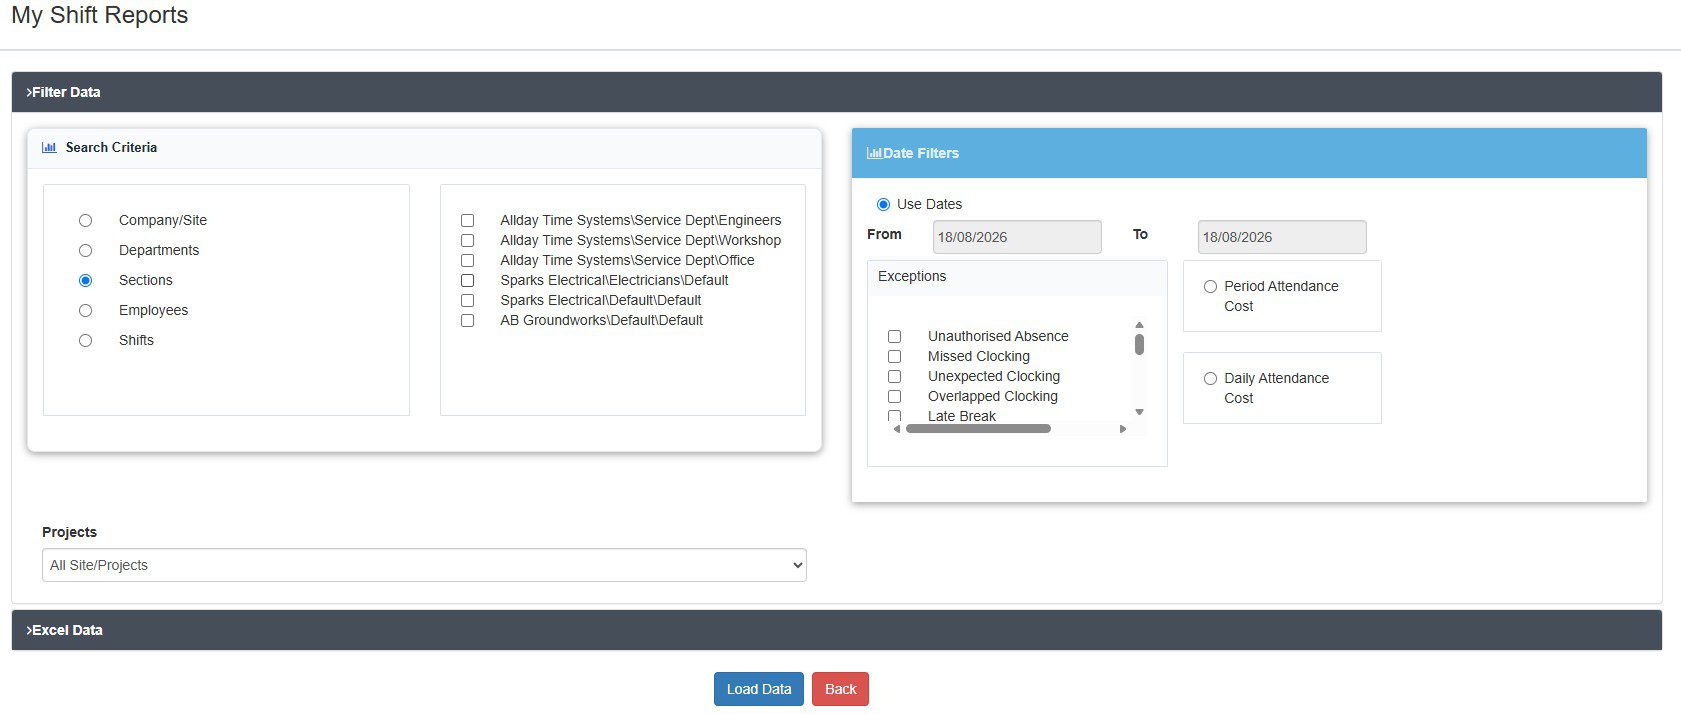
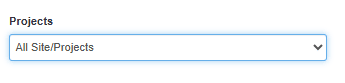
You can also select all sites or projects and if needed select a single site project from the drop list available.
Once we’ve selected these and any other option we want, scroll down and click ‘Load Data.’

This will load up the data for us to arrange and export:
Data can be regrouped as needed by use of the three dots on any column header to group the data by that column and use the “columns” tick boxes to decide what you want it to export.
You can even arrange the columns yourself by clicking and dragging them or using the “Set Column Position” option.
Before you export, there’s also the option to save the export you’re creating for later use at the top:
Creating templates allows you to quickly load the export options you prefer or use regularly. When you’re done, simply click ‘Export to Excel’ for Freetime to convert your selections to an Excel document, which will auto-download to your downloads folder.
For further help and assistance, please contact the Allday Time support team via live chat for an instant response on the system or email support@alldaytime.co.uk or call 01252 544457.
Payroll Period Report #
This report is part of the Freetime Payroll system and as such can be accessed via the Payroll Dashboard as part of your process to export payroll hrs to Freetime Payroll but can also be used independently from the main reports section of the system.
This report can be used to produce weekly attendance hours for your employees but is particularly usefull if you pay employees overtime after a weekly target such as Overtime after 40hrs a week but you run payroll monthly. As weeks mostly do not divide into months very well there is mostly a part week at both ends of the month where it is difficult to determine if employees should get overtime or not. This report addresses this issue.
How does it do it
To use this report you must first setup your pay periods and payroll groups in the system dictionary Settings/Dictionary. Then you must allocate all employees to a Payroll Group. This allows you to correctly filter the employees to and payroll dates when running the report.
To use the grid, you must first filter the data you want to see the same way you selected in the clock card report. In the example below, we have once again selected Section A of Department 1. This time we’re filtering for Monday 26 May to Friday 30 May.
It’s also important you choose the type of report from the drop-down, as this will further filter the data to the format you want from the system. In this case we’re choosing the Full Period Details report to get all the information the system has.
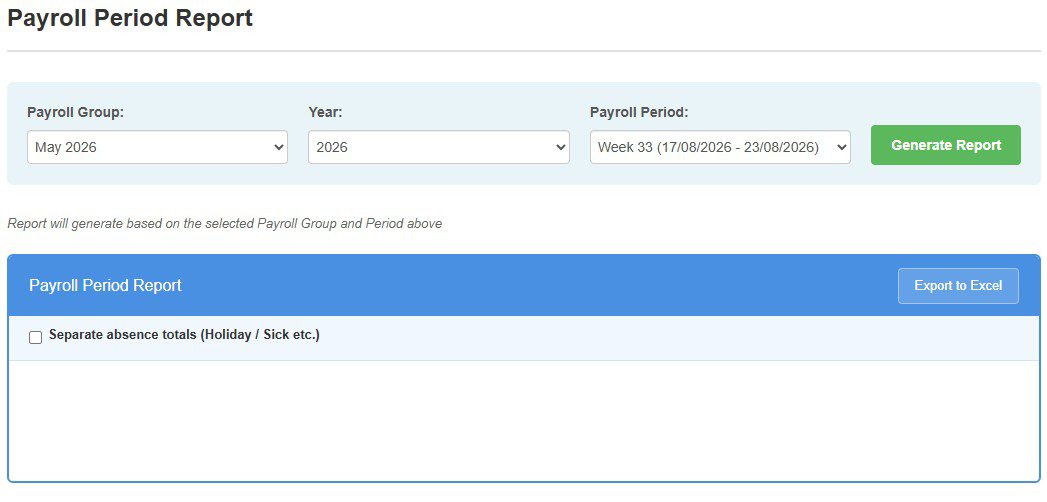
You can also select all sites or projects and if needed select a single site project from the drop list available.
Once we’ve selected these and any other option we want, scroll down and click ‘Load Data.’
This will load up the data for us to arrange and export:
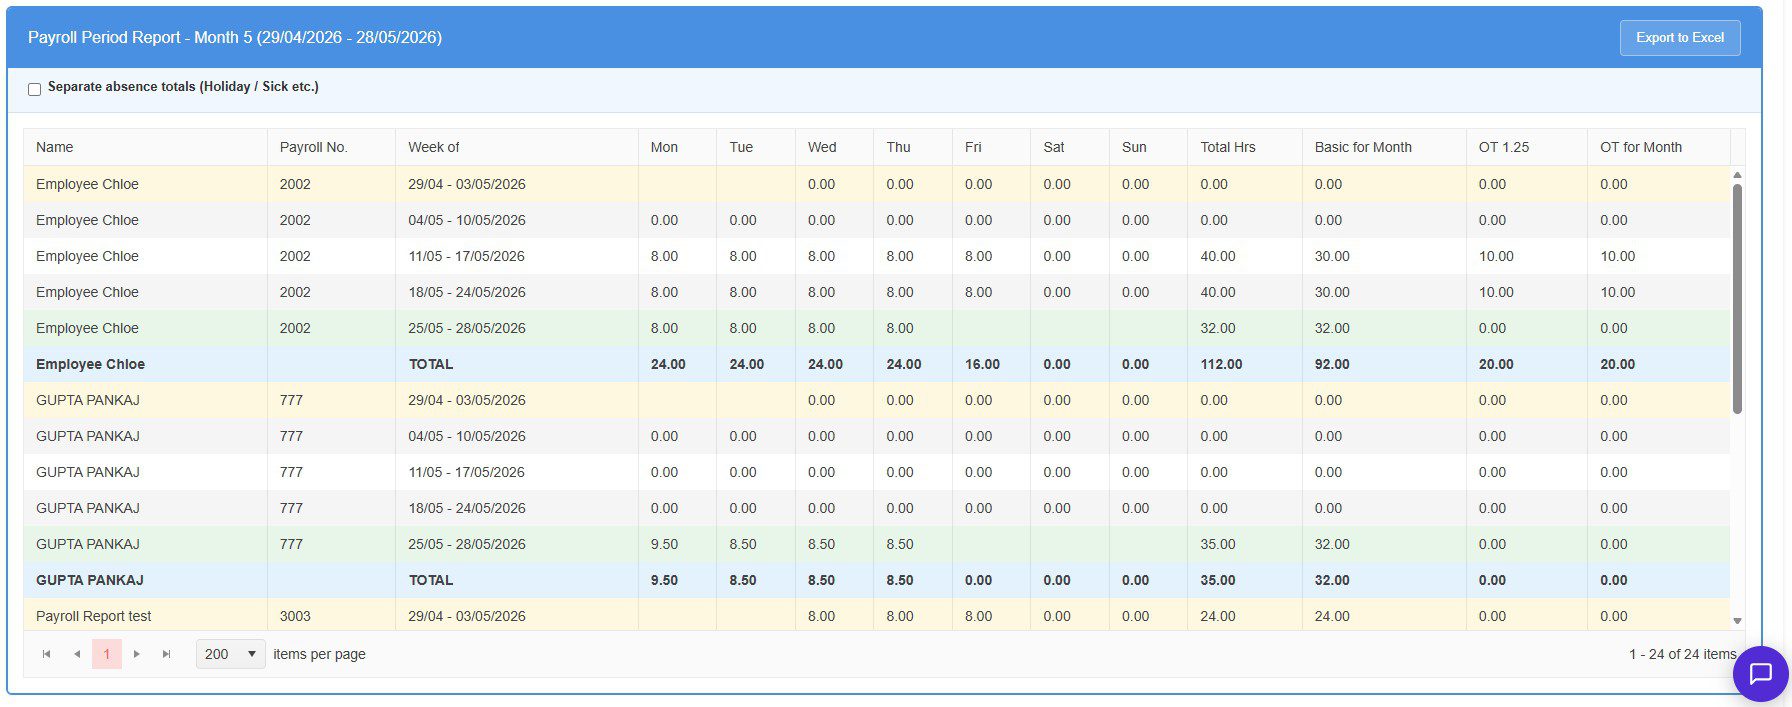
Data can be regrouped as needed by use of the three dots on any column header to group the data by that column and use the “columns” tick boxes to decide what you want it to export.
You can even arrange the columns yourself by clicking and dragging them or using the “Set Column Position” option.
Before you export, there’s also the option to save the export you’re creating for later use at the top:
Creating templates allows you to quickly load the export options you prefer or use regularly. When you’re done, simply click ‘Export to Excel’ for Freetime to convert your selections to an Excel document, which will auto-download to your downloads folder.
For further help and assistance, please contact the Allday Time support team via live chat for an instant response on the system or email support@alldaytime.co.uk or call 01252 544457.


